Chapter 6 Measurement Error
6.1 Chapter Notes
The introduction of this chapter talks about the International Prototype of the Kilogram, an object that was used to define the mass of the kilogram from 1889 until 2019. The US National Bureau of Standards calibrated their scales ultimately against their national prototype kilogram (Kilogram #20) that had been designed to weigh as close as possible to the International Prototype.
The chapter talks about a 10 gram check weight called NB10 acquired by the Bureau around 1940. Here are some measurements of the weight, in each case care was taken to control all relevant factors that could affect the result:
- 9.999591 grams
- 9.999600 grams
- 9.999594 grams
- 9.999601 grams
- 9.999598 grams
The Bureau works in micrograms short of 10g. So the measurements above would be
- 409
- 400
- 406
- 399
- 402
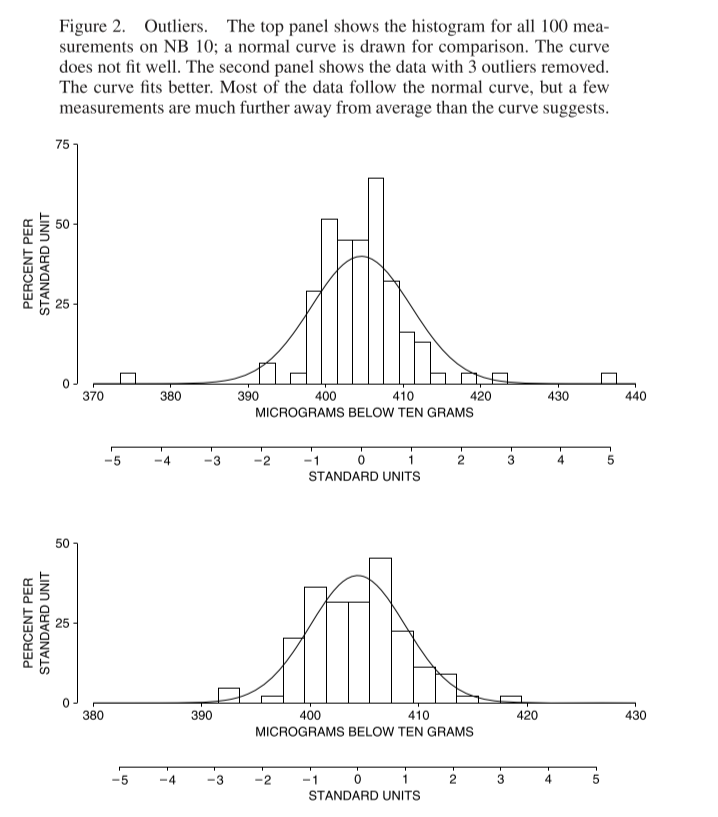
400 micrograms is the weight of a grain or two of salt. There is a table in the chapter of 100 weighings of NB10. The mean measurement was 405 micrograms below 10 grams, with a standard deviation of 6 micrograms.
The measurements in the table do not fit a normal curve very well. A few outlier measurements up to 5 standard deviations from the mean inflate the sample standard deviation. This means that 86% of the measured values are within one standard deviation of the mean instead of the 68% predicted by a normal distribution. The outliers are not mistakes: as far as the Bureau could tell nothing went wrong in these measurements. There is a comparison graph of the data against a normal curve with and without the outliers:
There’s a nice bit about treatment of outliers first from the Bureau:
A major difficulty in the application of statistical methods to the analysis of measurement data is that of obtaining suitable collections of data. The problem is more often associated with conscious, or perhaps unconscious, attempts to make a particular process perform as one would like it to perform rather than accepting the actual performance …. Rejection of data on the basis of arbitrary performance limits severely distorts the estimate of real process variability. Such procedures defeat the purpose of the … program. Realistic performance parameters require the acceptance of all data that cannot be rejected for cause.
Then from the chapter:
There is a hard choice to make when investigators see an outlier. Either they ignore it, or they have to concede that their measurements don’t follow the normal curve. The prestige of the curve is so high that the first choice is the usual one—a triumph of theory over experience.
The chapter distinguishes systemic error (or bias) from chance error. Bias affects all measurements the same way, pushing them in the same direction. Examples given are a butcher weighing a steak with a thumb on the scale, or a fabric store measuring linen using a tape measure that has stretched from 36 inches to 37. If there is no bias, the long-run average of repeated measurements should give the exact value of the thing being measured.
Fun chapter.