Chapter 27 More Tests for Averages
27.1 Chapter Notes
We want to find the expected value and standard error for the difference between two sample averages.
Say we take 400 draws from a box A and 100 from a box B, both with replacement. The box averages and standard deviations are below
- Box A: Average 110, SD 60
- Box B: Average 90, SD 40
The expected value for the difference is 110 - 90 = 20.
The standard errors for our sample averages are \(60 / \sqrt400 = 3\) and \(40 / \sqrt{100} = 4\). The standard error for the difference is \(\sqrt{3^2 +4^2}=5\).
For two independent samples, the standard error for the difference is
\[ \sqrt{a^2 + b^2} \] where \(a\) is the SE for the first sample, and \(b\) the standard error for the second.
So if we have two samples, and want to decide whether the differences between the sample averages should be put down to chance, we can use the two-sample z-statistic:
\[ z = \frac{\text{observed difference} - \text{expected difference}}{SE \text{ for the difference}} \] Often we will be assuming that the expected difference is zero, if for example we’re running a null hypothesis test where the null hypothesis that both samples were drawn from the same population.
It’s important to note that the two-sample z-statistic assumes that we are dealing with two independent simple random samples.
This kind of test can be used to analyse certain kinds of experiments. I.e. where the experimenters randomly assign subjects to one of two groups: control or treatment.
Here’s an interesting section on how the assumptions of the test are violated in this scenario:
Now, a look behind the scenes. In working the example, you were asked to pretend that the treatment and control samples were drawn independently, at random with replacement, from two boxes. However, the experiment wasn’t done that way. There were 200 subjects; 100 were chosen at random—without replacement—to get the vitamin C; the other 100 got the placebo. So the draws are made without replacement. Furthermore, the samples are dependent. For instance, one subject might be quite susceptible to colds. If this subject is in the vitamin C group, he cannot be in the placebo group. The assignment therefore influences both averages.
So what are reasons for believing that the standard error will come out correctly, given the violated assumptions?
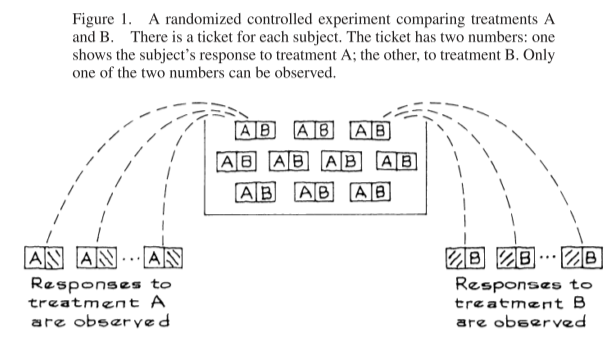
The two box model described in the example at the start of this chapter does not reflect what is happening with RCTs (unless the subjects are really chosen as a random sample from a large population - usually not the case).
The box model for most RCTs is really more like the following:
We have a number of tickets in a box, one for each subject. Each ticket now has two numbers on it: one for the subject’s response if receiveing treatment A, and one for their response if receiving treatment B. Only one of these will be observed for each subject. The experimenters randomly draw about half of the tickets without replacement and observe the A value. They then draw the rest of the tickets and observe the B value.
Problems for using the two-sample z-statistic:
- The draws are made without replacement, but the SEs are computed as if drawing with replacement.
- The two averages are dependent, but the SEs are combined as if the averages were independent.
The averages are dependent because if one person is assigned to treatment A they are not assigned to treatment B.
So why do we trust the computed SE?
It is a lucky break that when applied to randomized experiments, the procedure of section 2 is conservative, tending to overestimate the SE by a small amount. That is because the two mistakes offset each other. * The first mistake inflates the SE. * The second mistake cuts the SE back down.
To make the mathematics work, the SEs for the two sample averages must be computed on the basis of drawing WITH replacement—even though the draws are made WITHOUT replacement. That is what compensates for the dependence between the two samples.
There is a long endnote here with more detail.
We should not use the z-statistic when we record two correlated responses for each subject.
Further Reading
Chapter 27 endnote 11 and the references there.